Vector Graphs

Visual thinking Survey stats statistics shapes people information infographics Graph vector Geometry diagrams data charts

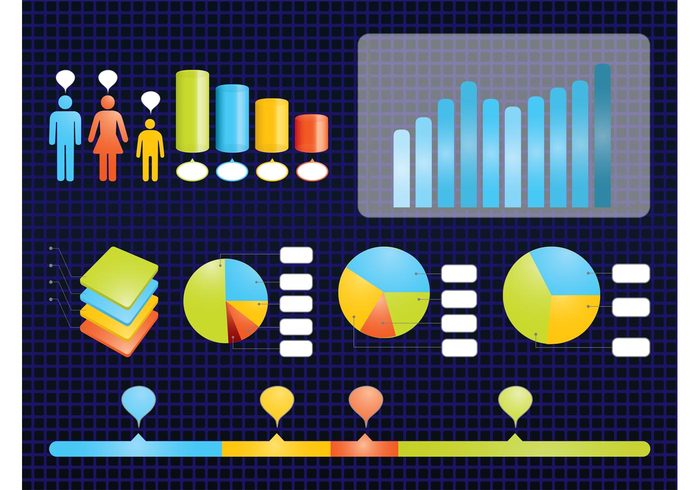
Data visualization vector set with diagrams and info graphics. Visual representations of survey data with different colors and shapes. Pie charts, three-dimensional diagrams with stacked shapes, lines, bars and people silhouettes. Free design to create survey, data, information and statistics designs.

1 Star2 Stars3 Stars4 Stars5 Stars (No Ratings Yet)
Loading...

Leave a Reply

Your email address will not be published. Required fields are marked *

WeLoveSoLo © 2014-2019 90 queries in 0.090 seconds, using 38.50MB memory