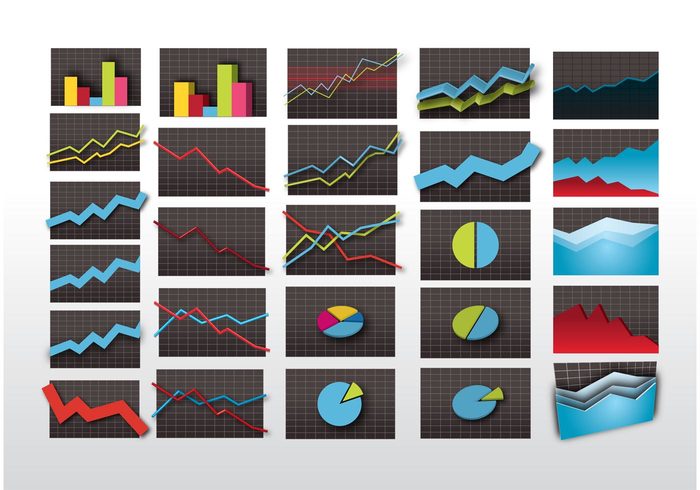
Stock Market Graphics

trade stock statistics share sale report profit office Monitoring money investment business Balance Asset analysis accounting

Free analysis of stock market vector graphs for your finance, economics, earnings, development, marketing and business data graphics. If many people buy stocks, prices go up. If more people sell than buy, value goes down. Cool vector visuals to show the stock market value of shares.

1 Star2 Stars3 Stars4 Stars5 Stars (No Ratings Yet)
Loading...

Leave a Reply

Your email address will not be published. Required fields are marked *

WeLoveSoLo © 2014-2019 90 queries in 0.083 seconds, using 38.50MB memory